
 English
Corning® Cell Counter
Automatisiertes Zellzählen, so schnell und einfach wie noch nie. Der Cell Counter von Corning verfügt jetzt über eine deutlich verbesserte und umfangreichere Software. Durch die Cloud-basierte Verarbeitung wurden dem Zellzähler Features und Funktionen hinzugefügt, die auf Benutzeranforderungen basieren. Diese Updates werden allen Benutzern zur Verfügung gestellt.
Zellzählungen in drei Sekunden
Der Corning Cell Counter kann eine einzelne Zellzählung in weniger als drei Sekunden durchführen. Dies ist viel schneller als die meisten automatisierten Zellzähl-Systeme. Der Corning Cell Counter kann mithilfe der CytoSMART ™ Cloud-App die Bilder auf der Microsoft Azure Cloud Computing-Plattform verarbeiten. Diese Cloud-Computing-Fähigkeit bedeutet, dass die Bilder schneller analysiert werden können als mit jedem vorhandenen Onboard-Computer. Unter Verwendung von Trypan Blau kann die Viabilität der Zellen erkannt werden. Der Corning Cell Counter kann Zellcluster erkennen, was zu genauen Zellzahlen von „hochkonzentrierten Proben“ (bis zu 1 x 10⁷ Zellen/ml) führt. Die neue Multicount-Funktion ermöglicht mehrere Bilder pro Probe und erhöht so die Gesamtgenauigkeit. Der neue Algorithmus ermöglicht die Analyse von Säugetierzellen bis zu einer Größe von 4 μm ohne Geräte-Upgrade. Für die Viabilität beträgt der Bereich 5-70µm. PBMC- und CAR-T-Zellen können genau gezählt werden. Jede gängige Zellkammer kann verwendet werden.
Easy to use
Für die einfache Verwendung ist kein spezielles Training nötig. Der Corning Cell Counter wird einfach an ein Tablet oder PC angeschlossen und über die CytoSMART Cloud App gestartet. Aufgrund der Cloud-Technologie sind die Daten immer auf Ihrem Smartphone, Tablet oder Computer zugänglich.
Wir haben ein Demogerät verfügbar, bitte kontaktieren Sie uns. Gerne stellen wir auch die verfügbaren Application Notes zur Verfügung.
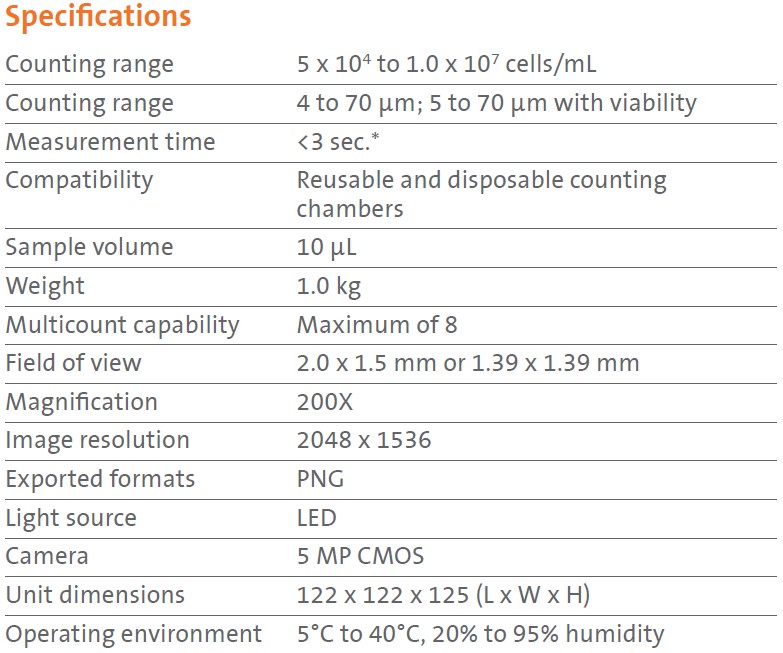
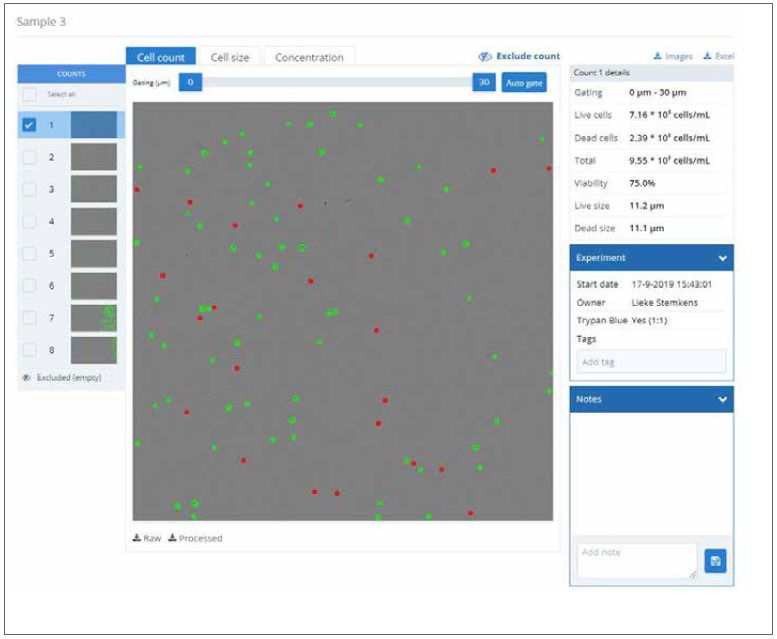
Figure 1. Results page after performing multiple counts with the Version 3
algorithm. In the top left the sample name is displayed. Underneath this you can
see the tutorial button, the counts taken of this sample, and the dilution calculator.
The box on the top right contains details of the count. General information is
displayed in the “Experiment” box, while notes can be added in the “Notes” box.
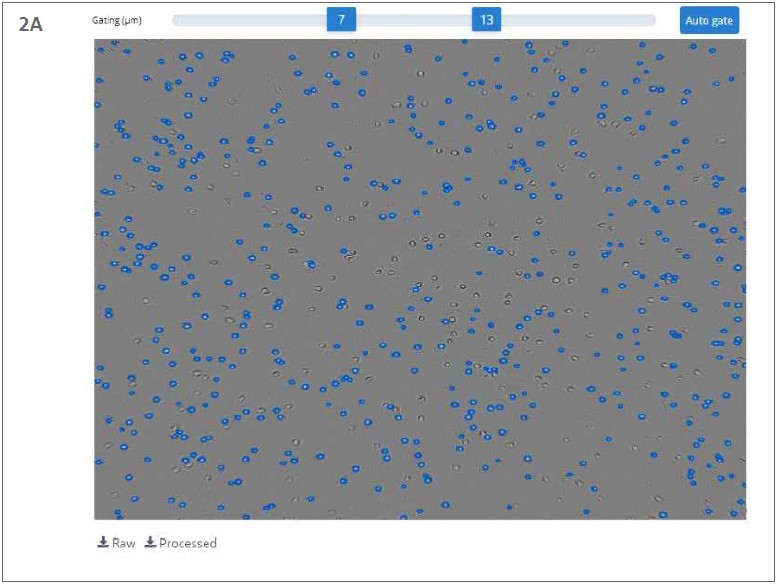
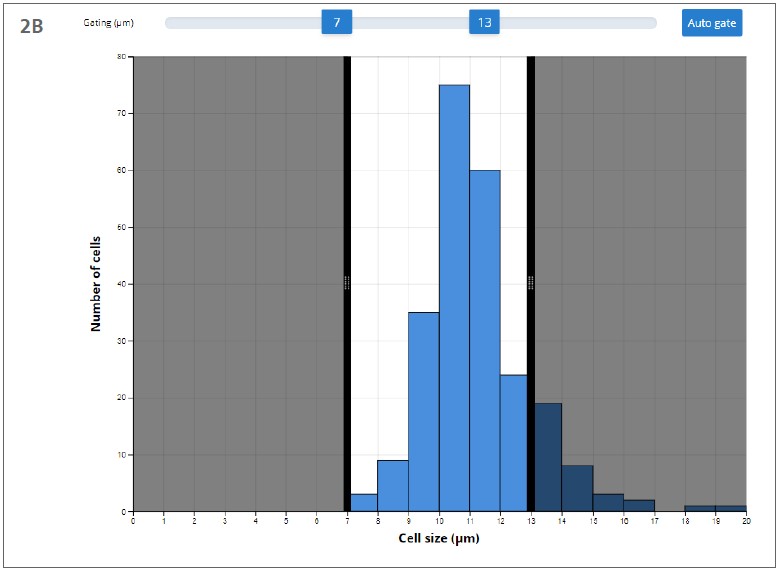
Figure 2. Example of live gating using the gating slider. The minimum and
maximum are set on 7 and 13 μm, respectively. (A) Live gating in the “Cell count”
tab. Cells that are smaller than 7 μm or larger than 13 μm are not encircled in blue.
(B) Live gating in the “Cell size” tab. The shaded regions represent the excluded
values.
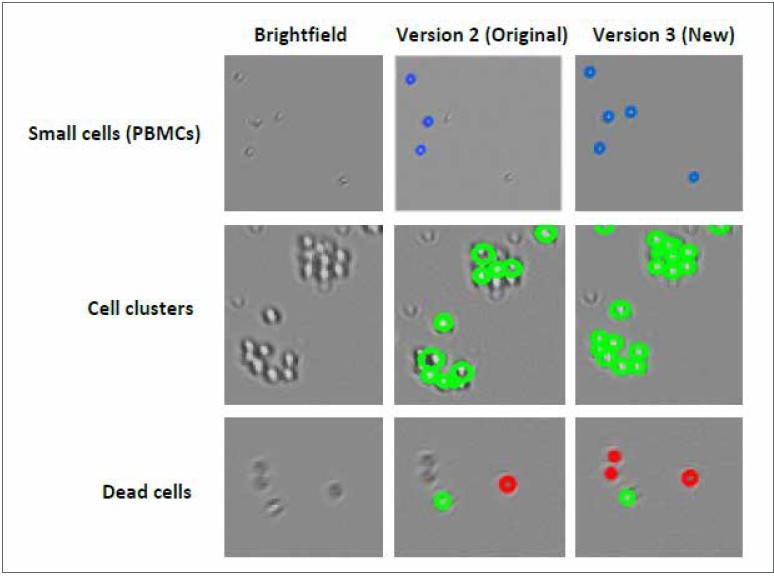
Figure 3. Visualization of the improvements of the Version 3 algorithm. The
columns (from left to right) represent the Brightfield images, the Version 2 (Original)
processed image, and the Version 3 processed image, respectively. The rows (from
top to bottom) represent samples that contain small cells, cell clusters, or dead cells,
respectively.
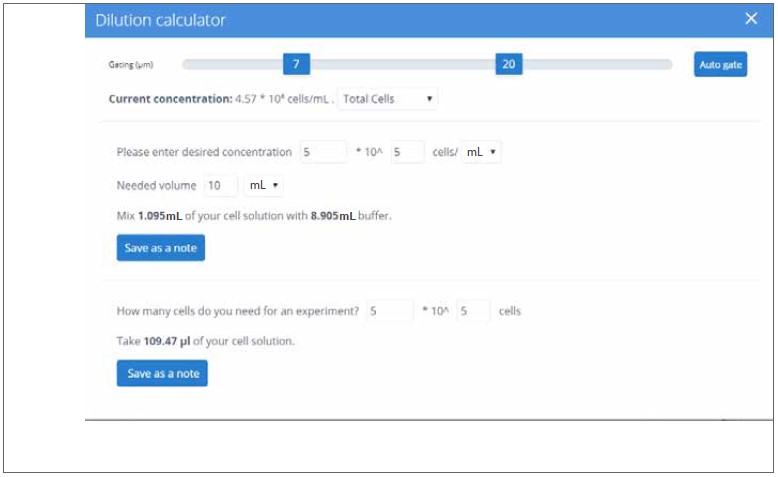
Figure 4. Dilution calculator. The dilution calculator can be used for several
purposes. A user can enter the concentration they need in a certain volume using
the values of the live/dead/total cell concentrations. It also calculates how much
volume of the counted cell suspension is required for a certain number of cells.