Deutsch
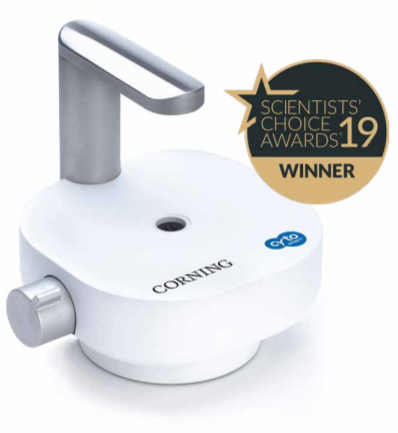
Corning® Cell Counter
Automated cell counting, faster and easier than ever. The Corning Cell Counter now features a significantly improved software. Employing cloud-based processing, features and functions based on user requirements were added. These updates are available to all users.
Three-second Cell Counts
The Corning Cell Counter can perform a single cell count in less than three seconds. This is much faster than most automated cell counting systems. The Corning Cell Counter processes the images on the Microsoft Azure Cloud Computing platform using the CytoSMART ™ cloud app. With cloud computing capability the images are analysed faster than with an onboard computer. Using Trypan Blue the viability of the cells can be recognized. The Corning Cell Counter can detect cell clusters and calculates exact cell numbers of "highly concentrated samples" (up to 1 x 10⁷ cells/ml). The new multicount function enables multiple images per sample and thus increases the overall accuracy. The new algorithm allowes the analysis of mammalian cells up to 4 μm in size without a device upgrade. For viability, the range is 5-70 µm. PBMC and CAR-T cells can be counted precisely. Any common cell counting chambers can be used.
Easy to use
The device is very easy to use and no special training is required. The Corning Cell Counter is simply connected to a tablet or PC and started via the CytoSMART Cloud App. Thanks to cloud technology, the data are always accessible on your smartphone, tablet or computer.
Please contact us for a dome and the available application notes.
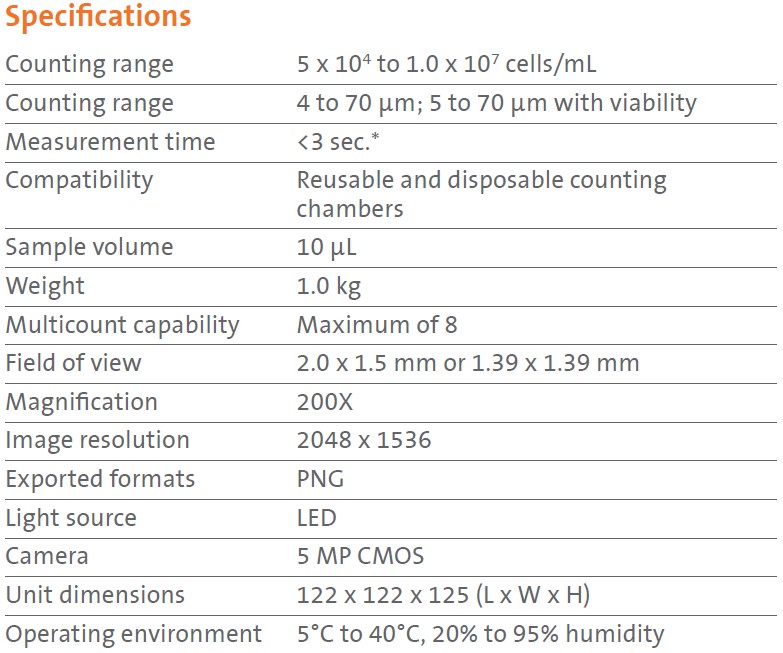
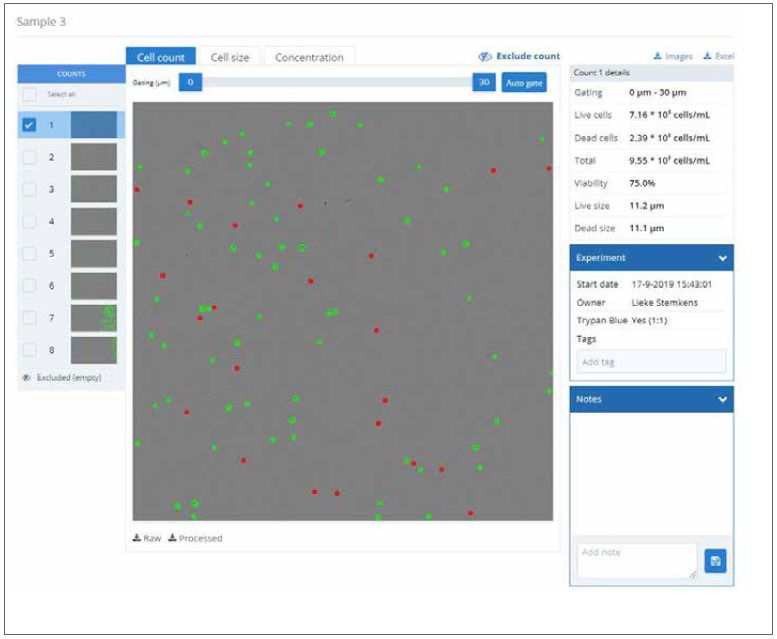
Figure 1. Results page after performing multiple counts with the Version 3
algorithm. In the top left the sample name is displayed. Underneath this you can
see the tutorial button, the counts taken of this sample, and the dilution calculator.
The box on the top right contains details of the count. General information is
displayed in the “Experiment” box, while notes can be added in the “Notes” box.
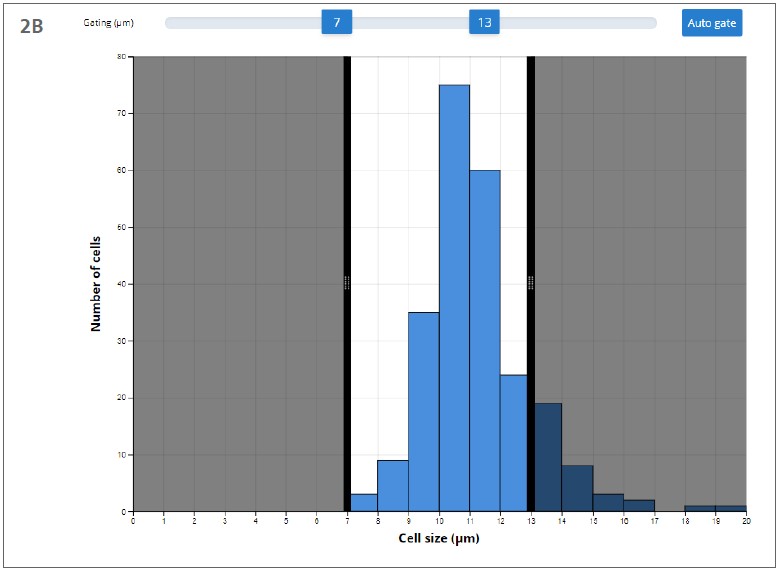
Figure 2. Example of live gating using the gating slider. The minimum and
maximum are set on 7 and 13 μm, respectively. (A) Live gating in the “Cell count”
tab. Cells that are smaller than 7 μm or larger than 13 μm are not encircled in blue.
(B) Live gating in the “Cell size” tab. The shaded regions represent the excluded
values.
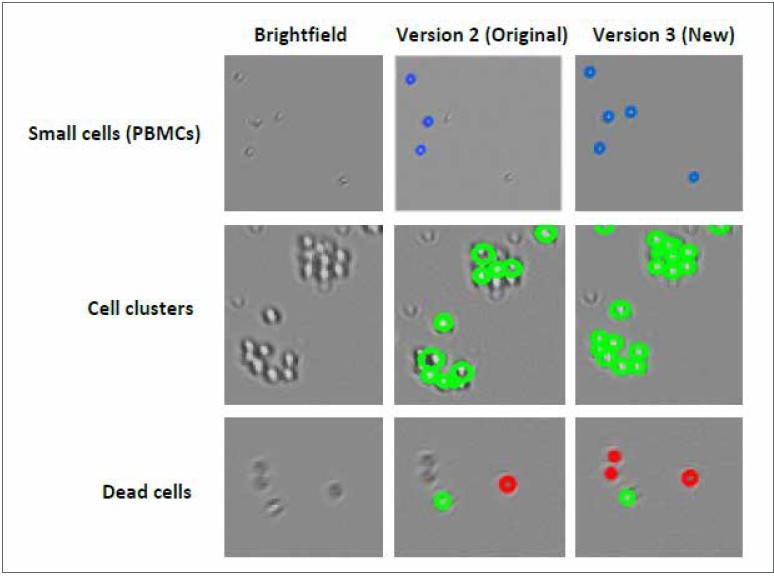
Figure 3. Visualization of the improvements of the Version 3 algorithm. The
columns (from left to right) represent the Brightfield images, the Version 2 (Original)
processed image, and the Version 3 processed image, respectively. The rows (from
top to bottom) represent samples that contain small cells, cell clusters, or dead cells,
respectively.
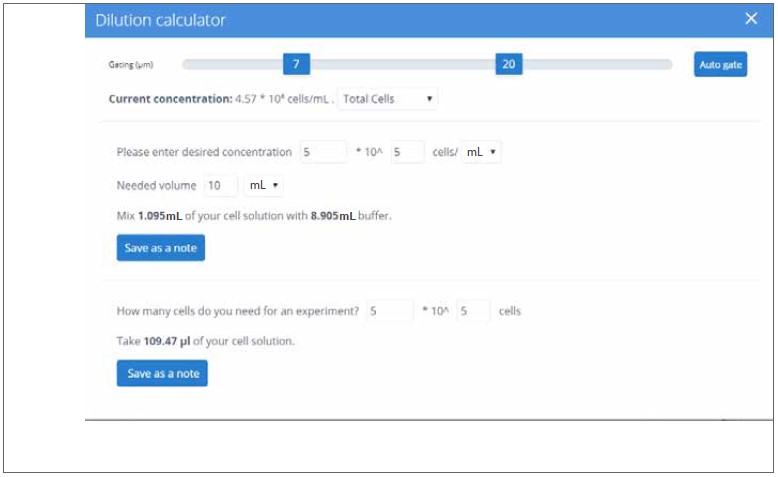
Figure 4. Dilution calculator. The dilution calculator can be used for several
purposes. A user can enter the concentration they need in a certain volume using
the values of the live/dead/total cell concentrations. It also calculates how much
volume of the counted cell suspension is required for a certain number of cells.